Feed overview

Vlad
Last Update 10 bulan yang lalu
Stats
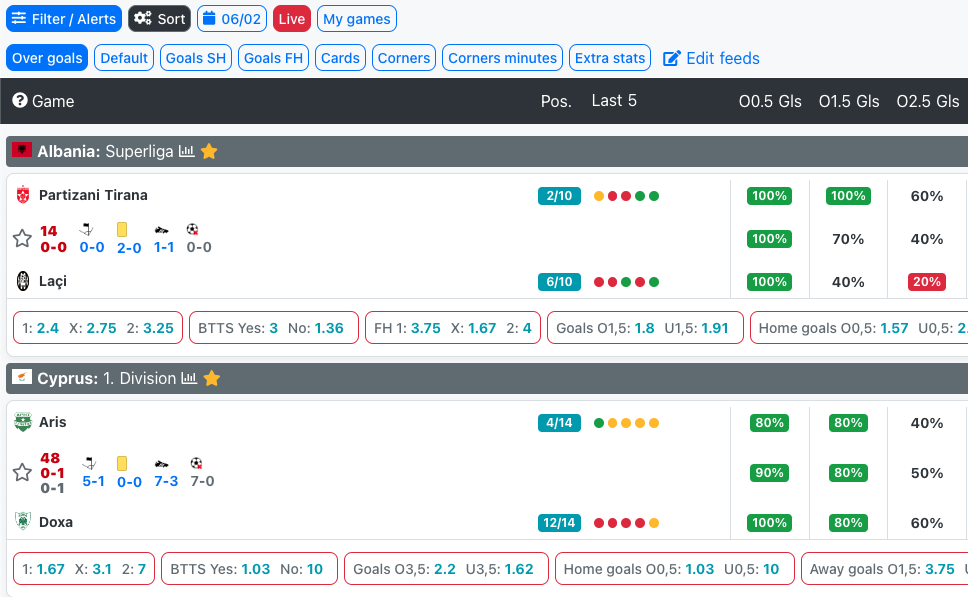
On the first login in the app default stats are shown. Feed contains 10 stats boxes that can be customized, check Feed section.
After you create multiple feeds, you can switch between feeds from this page, with one click.
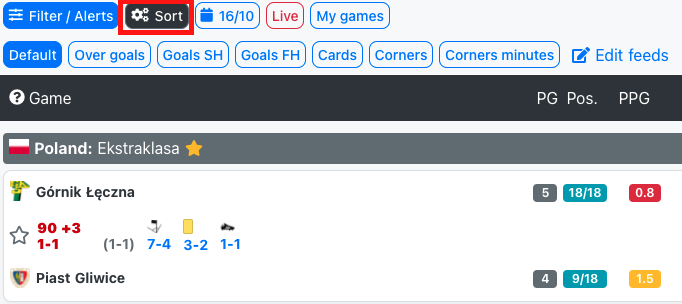
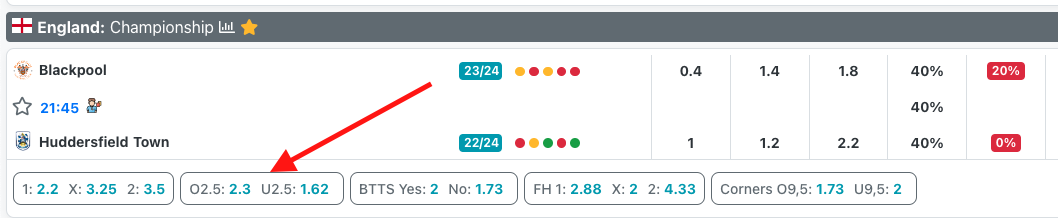
Played games (PG), position (Pos.), Points per game (PPG), Form (Last 5) are shown for all feeds.
We show stats based on home games for local team and based on away games for visitor team.
By default, we show stats calculated for the last 5 games ordered by country name ascendent. By default time for games is UTC + 1.
By default, you see not started and live games. If you want to see finished games you can change that through Filters section.
All defaults can be changed by clicking on the black cogs button on the top. Check Settings subcategory.
The line in the middle represents the mean value between home game stats and away game stats. E.g. stat for home team 80%, stat for away team 100%, the mean value is 90%.
Green boxes represent stats with values greater than or equal to 75%. Red boxes represent stats with values less than or equal to 25%.
You can see what every stat means by clicking on the ? on the top left corner of the header.
You can see games for today and the next 4 days. Also, from the blue calendar button on top, you can go in the past to any date to see the stats and results.
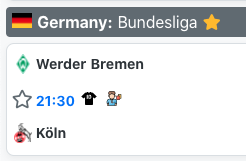
Lineups / Referees
If the game is not started and data regarding lineups and/or referees are available we show a specific icon for each one.
Odds
For each game, you can see pre-match odds or live odds based on the available lines.
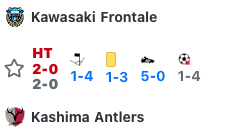
Live stats
If the game goes live we show minute, score, corners, cards, shots on the target, shots off target on the line in the middle between team names.
Live stats are refreshed in the background, you don't have to refresh the page to update stats.
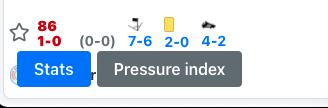
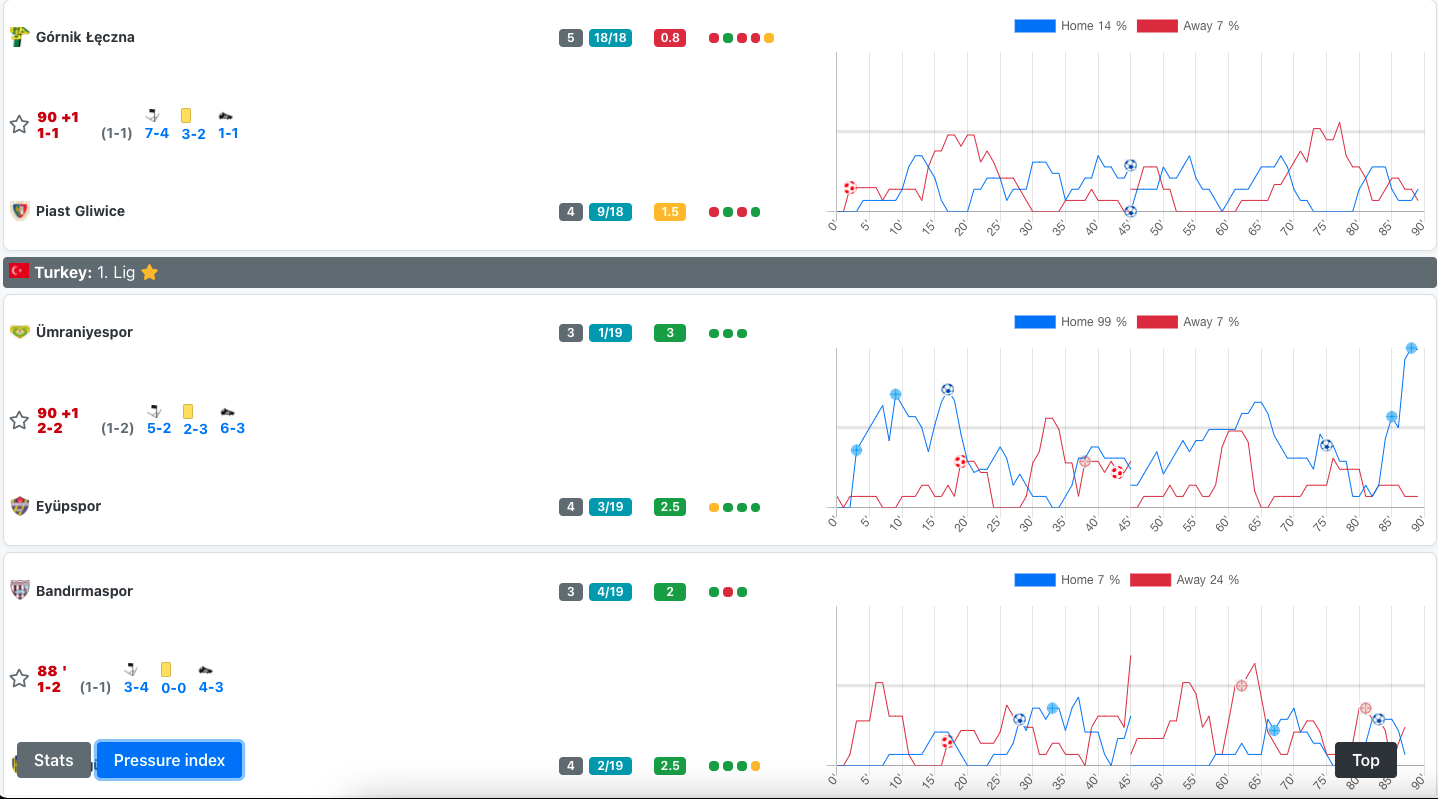
Live - Pressure index view
On the live page, you can switch between stats view and pressure index view. You can do that from the buttons on the bottom left of the screen.
On the pressure index view you can view pressure index graph for each game on the same page instead of clicking on every game to see pressure index chart on game page.
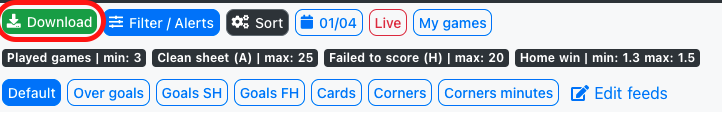
Download games
After you apply a filter you can download all the games for that filter as a .xlsx file. The file contains all the games details including start time, league name, team names, live stats and pre games stats from your selected feed. You can switch feed and download file again if you want to change pre game stats.
The file can be downloaded from the green 'Download' button on top of the feed, next to 'Filters/Alerts' button.